In the following figure, the first panel shows a market situation prior to regulation and the second panel shows the effects of regulation. Figure 12.2 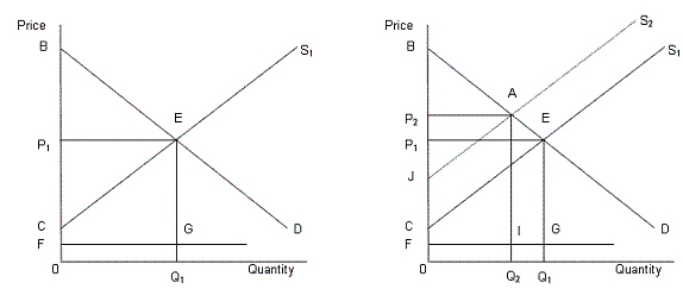 In the figure,
D: Demand curve for automobiles
S1: Supply curve of automobiles prior to regulation
S2: Supply curve of automobiles after regulation
FG: Clean up cost per unit
According to Figure 12.2, the total clean up cost after the regulation is:
Definitions:
Bond Payable
A financial instrument representing a loan made by an investor to a borrower, typically corporate or governmental, with a promise to pay back the principal along with interest on specified dates.
Operating Activities
Activities that constitute the primary or main activities of a company, such as selling goods and services, which are reflected in the income statement.
Statement Of Cash Flows
A financial statement that provides aggregate data regarding all cash inflows and outflows a company receives.
Direct Method
In cash flow accounting, this method itemizes major classes of gross cash receipts and payments, providing a more detailed view of a company's cash flows from operating activities.
Q13: A horizontal aggregate supply curve indicates that
Q18: Why do the regulated companies oppose deregulation?<br>A)They
Q20: A drop in consumption or investment spending
Q42: If the reserve requirement is 33.3 percent,
Q57: The figure given below shows the demand
Q69: The pursuit of low unemployment rates must
Q89: The Justice Department of the U.S.classifies the
Q91: The following figure shows the revenue and
Q100: In high-inflation countries, workers prefer to spend
Q109: The efficiency loss that occurs when a