The figure given below shows the revenue and cost curves of a monopolistically competitive firm. Figure: 11.3 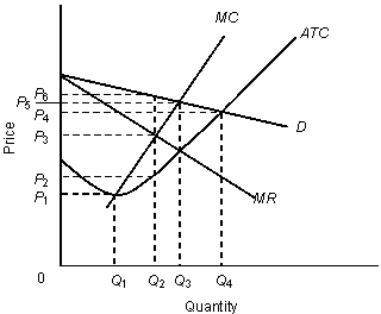 In the figure,
D: Demand curve
MR: Marginal revenue curve
MC: Marginal cost curve
ATC: Average total cost curve
The profit per unit of output for the firm in the Figure 11.3 is:
Definitions:
Economic Profit
The difference between total revenue and total costs, including both explicit and implicit costs, representing the surplus generated beyond the firm’s opportunity costs.
ATC
Average Total Cost; it's the total cost per unit of output, calculated by dividing the total cost by the quantity of output produced.
Variable Cost
Expenses that change in proportion to the production volume.
Economic Profit
The difference between total revenue and total costs, including both explicit and implicit costs, reflecting the true profitability of a business.
Q4: In long-run equilibrium, the monopolistically competitive firm:<br>A)will
Q9: An outward shift of the money demand
Q10: National debt can be defined as:<br>A)the total
Q19: When depository institutions have negative excess reserves,
Q44: The Fed controls the money supply to
Q58: For a monopolist with a linear demand
Q60: If a banking system receives an initial
Q65: Firms that have downward-sloping demand curves:<br>A)earn positive
Q67: A market failure occurs when:<br>A)the market outcome
Q67: Compared with a perfectly competitive firm in