The figure given below shows the revenue and cost curves of a monopolistically competitive firm. Figure: 11.3 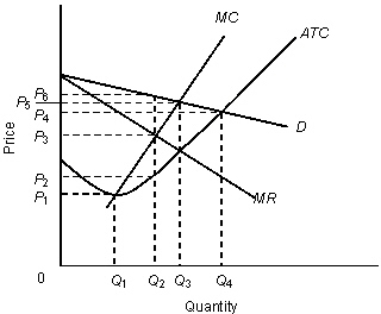 In the figure,
D: Demand curve
MR: Marginal revenue curve
MC: Marginal cost curve
ATC: Average total cost curve
Refer to Figure 11.3.A perfectly competitive outcome would exist at a price of _____ and an output level of _____.
Definitions:
Industrial Service
Services offered by businesses to other businesses within the industrial sector, including maintenance, repair, and consulting services.
Ancillary Service
Additional services or support provided beyond the primary product or service offering to enhance customer satisfaction.
Accountant
A professional responsible for managing financial records, tax filings, and providing financial advice to individuals or businesses.
Services
Intangible products such as activities, benefits, or satisfactions offered for sale that do not result in the ownership of anything.
Q22: The table given below shows the assets
Q44: A regulated firm may have an incentive
Q81: Which of the following is true of
Q84: Perfect competition provides one model in which
Q93: Why was trucking deregulated in the U.S.in
Q109: In order to survive, cartels must be
Q118: The M2 measure of money supply includes
Q119: When resources are commonly owned, there are
Q127: If Saving+Tax+Import > Investment+Government spending+Export, then _
Q137: If a bond pays a fixed return