The figure given below shows the cost and revenue curves of a monopolist. Figure 10.9 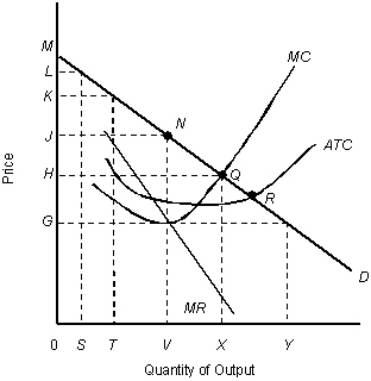 D: Average revenue
MR: Marginal revenue
ATC: Average total cost
MC: Marginal cost
Refer to Figure 10.9.Suppose that the market is perfectly competitive.The consumer surplus would be represented by the area _____.
Definitions:
Monopoly Firms
Entities that are the sole providers of a product or service in a market, facing no competition.
Downward-Sloping
A term often used in economics to describe a line or curve on a graph that demonstrates a decrease in one variable as another increases.
Demand Curve
A graph showing the relationship between the price of a good and the quantity of the good that consumers are willing and able to purchase at each price.
Perfectly Elastic
Refers to a situation in which the quantity demanded or supplied changes infinitely in response to any change in price.
Q2: The thrift institutions:<br>A)were nonprofit banking institutions.<br>B)were owned
Q17: Ceteris paribus, if the U.S.federal government reduces
Q23: The ordering of market structures from most
Q47: The theory of the long run in
Q49: Cities and local governments in the United
Q54: If a market becomes deregulated and is
Q64: When the perfectly competitive firm's demand curve
Q85: One difference between economic and social regulation
Q88: Being a monopoly or attempting to monopolize
Q99: The figure given below shows the revenue