The figure given below shows the aggregate expenditure curve of an open economy. Figure 10.1 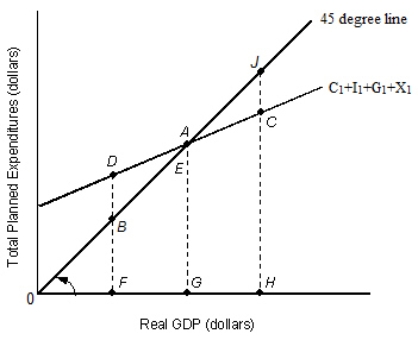 In the figure:
C1: Consumption
I1: Investment
G1: Government spending
X1: Net Exports
According to Figure 10.1, when real GDP is at G:
Definitions:
Q14: If the spending multiplier equals 6 and
Q19: The figure given below represents the macroeconomic
Q30: The Social Security tax structure in the
Q35: Assume that an economy is in equilibrium
Q42: Firms under perfect competition produce:<br>A)homogeneous products.<br>B)unique products.<br>C)either
Q54: Which of the following is a characteristic
Q79: Consumers are willing to pay a higher
Q100: A zero economic profit is not a
Q104: Suppose that in a perfectly competitive market,
Q105: A most-favored customer is one who:<br>A)buys a