The figure given below represents the leakages and injections in an economy. Figure 10.2 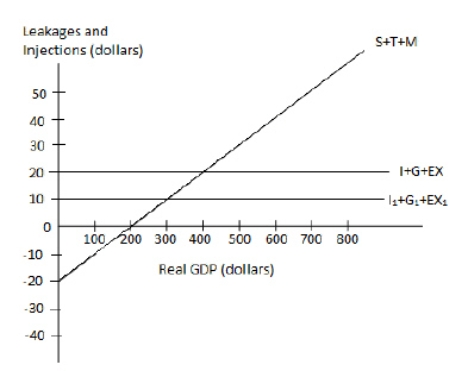 In the figure:
I, I1: Investment;
G: Government spending;
EX, EX1: Exports;
T: Taxes;and
M: Imports.
Refer to Figure 10.2.When total injections equal $20, the equilibrium level of real GDP is:
Definitions:
Plant Size
The scale or capacity of a factory or production facility, often measured in terms of productive capability or physical dimensions.
Diseconomies of Scale
An economic concept where increasing production results in higher per unit costs.
Long-run Average Total Cost
The average cost per unit of output over the long term, where all inputs are considered variable, allowing firms to adjust all factors of production.
Plant Sizes
The physical capacity or scale of a manufacturing facility, which can influence production volume, efficiency, and cost.
Q18: Lower interest rates on business loans usually
Q31: Monopolization is a process by which the
Q42: The figure given below shows the revenue
Q52: The following figure shows equilibrium at the
Q59: On August 5, 2003, a tragic fire
Q69: Consider an oligopoly that has two firms,
Q71: Assume that a GDP gap can be
Q90: The 45-degree line used in a consumption
Q123: Scenario 10.2 A hypothetical open economy has
Q124: The table given below records the amount