Multiple Choice
The figure given below represents the leakages and injections in an economy. Figure 10.3 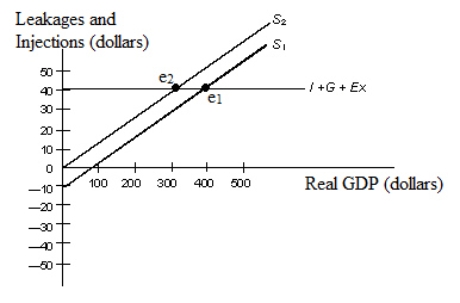 In the figure:
S1 and S2: Saving functions
I: Investment
G: Government spending
EX: Net exports
In Figure 10.3, which of the following represents the paradox of thrift?
Definitions:
Related Questions
Q14: In contrast to both perfect competition and
Q19: The income net of taxes is called
Q23: Certain actions by oligopolistic firms can lead
Q28: According to economists, the fixed-price model of
Q34: Transfer payments that use income to establish
Q41: According to the permanent income hypothesis, when
Q74: The following graph shows the demand and
Q80: Why does a efficiency loss arise under
Q86: Once macroeconomic equilibrium has been established in
Q89: The U.S.dollar is the most important reserve