The figure given below represents the macroeconomic equilibrium in the aggregate income and aggregate expenditure framework.Assume that MPI is equal to zero. Figure 10.4 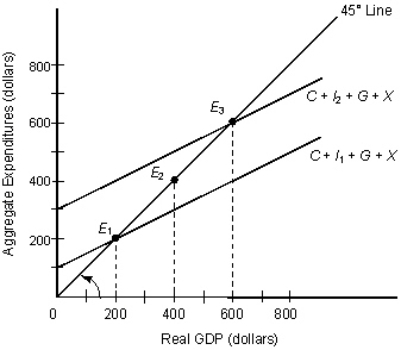 In the figure:
C: Consumption
I1 and I2: Investment
G: Government Spending
X: Exports
Refer to Figure 10.4.Compute the increase in investment spending from I1 to I2.
Definitions:
Market Rate of Interest
The prevailing rate of interest determined by supply and demand in the credit market at which borrowers and lenders agree to transact.
Stated Rate of Interest
The stated rate of interest is the fixed rate that a borrower agrees to pay to a lender, expressed as a percentage of the principal loan amount.
Bond Redemption
The process of repaying the face value of a bond to the bondholders upon its maturity.
Carrying Amount
The book value of an asset or liability on a company's balance sheet, reflecting its original cost adjusted for any depreciation, amortization, or impairment costs.
Q9: The figure given below represents the saving
Q13: If it is assumed that there are
Q21: Which of the following is true of
Q27: In contrast to perfect competition, in a
Q38: The following figure shows the revenue and
Q42: In the United States, monopoly regulation began
Q52: _ is the relation between total expenditures,
Q93: Why was trucking deregulated in the U.S.in
Q106: Quickie Inc. , a perfectly competitive firm,
Q113: The recessionary gap is given by the