The figure given below shows the revenue and cost curves of a perfectly competitive firm. Figure 9.2 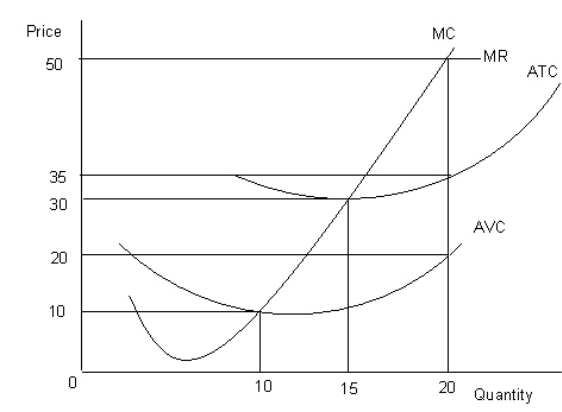 MC: Marginal cost curve
MR: Marginal revenue curve
ATC: Average-total-cost curve
AVC: Average-variable-cost curve
Refer to Figure 9.2.If the market price falls to $10, the firm would produce:
Definitions:
Replacement Selection
The process of identifying and selecting a candidate to replace an existing employee within an organization.
Mission Statement
A brief description of an organization's fundamental purpose and guiding principles, intended to inform its strategic vision and direction.
Organization's Vision
A strategic statement that outlines what an organization aspires to achieve in the future, guiding its direction and decision-making processes.
Values
Values are core beliefs or ideals that guide behavior, influence decisions, and shape cultural norms.
Q2: _ are elements of fiscal policy that
Q18: Other things equal, a marginal propensity to
Q33: A monopolistically competitive firm's demand curve slopes
Q34: A consumer becomes loyal to a product
Q40: The figure given below shows the demand
Q47: Planned investment is inversely related to the
Q87: The table given below reports the value
Q110: The long-run equilibrium price-output combination for a
Q114: In the short-run, an increase in the
Q118: Which of the following is true of