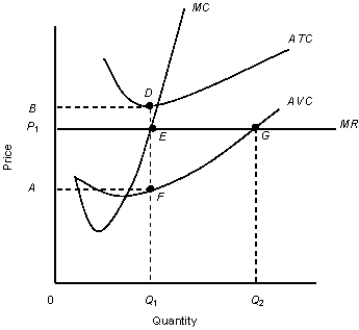
The figure given below shows the revenue and cost curves of a perfectly competitive firm.Figure 10.5
 MC: Marginal cost curve
MR: Marginal revenue curve.ATC: Average-total-cost curve
AVC: Average-variable-cost curve
-The permanent shut down point of a perfectly competitive firm, in the long run, is:
Definitions:
Telephone Groups
A method of conducting discussions or meetings where participants communicate over the phone, often used for research or support groups.
Privacy
The state or condition of being free from unauthorized interference or public attention, focusing on the right to keep personal information confidential.
Nonverbal Cues
Body language, facial expressions, and other physical behaviors that communicate messages without the use of words.
Preparing Environment
The process of arranging or modifying a setting to make it suitable for specific tasks or to enhance its functionality.
Q6: Increased domestic imports and higher international trade
Q22: Identify the correct statement about the aggregate
Q28: Under perfect competition, entry of new firms
Q36: Firms in monopolistically competitive markets spend significant
Q44: The figure given below represents the consumption
Q50: Discretionary fiscal policy is bestdefined as:<br>A)the deliberate
Q63: For a perfectly competitive firm in the
Q87: The following figures show the demand and
Q88: Which of the following variables is a
Q122: A firm's total revenue is $400 for