True/False
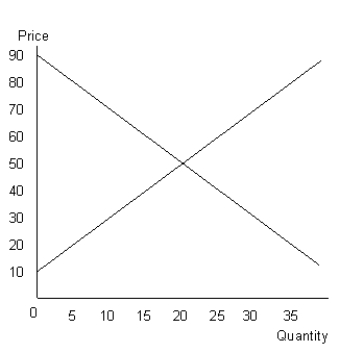
The figure given below shows the aggregate demand and supply curves of a perfectly competitive market.Figure 10.7

-Economic efficiency is achieved when the price of a unit of a commodity is equal to the marginal cost of producing that unit.
Definitions:
Related Questions
Q7: The figure given below shows the cost
Q23: A monopolist produces at the minimum point
Q25: According to the labor statistics of the
Q26: If the price level falls as real
Q32: Under long-run equilibrium in perfect competition, each
Q37: When revenue is less than total cost
Q41: Economic profits is the difference of total
Q69: Automatic stabilizers act to moderate business cycles
Q92: Suppose the Congress enacts a 5 percent
Q114: Which of the following is true of