Multiple Choice
The figure given below represents the saving function of an economy. Figure 9.1 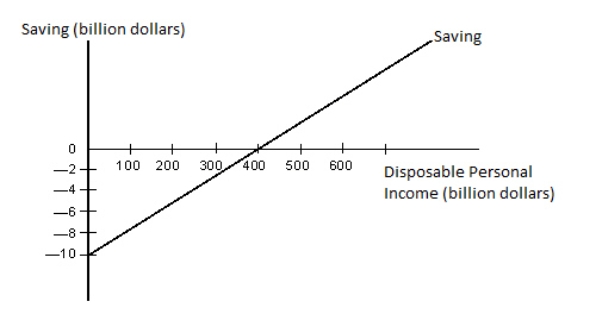 Refer to Figure 9.1.Which of the following statements is true for real GDP levels below $400 billion?
Understand the accounting treatment for insignificant cost variances.
Understand the process and significance of recording labor costs in financial statements.
Calculate and interpret direct materials cost variances, including price and quantity variances.
Identify and record various types of variances in a standard cost system.
Definitions:
Related Questions
Q1: In the long run, increased government spending
Q16: The figure given below depicts the tax
Q22: The market-demand curve for a product in
Q26: If the price level falls as real
Q47: The _ is the change in the
Q59: At the equilibrium level of income, which
Q62: During periods of inflation:<br>A)everyone's real income rises.<br>B)those
Q67: The marginal revenue curve of a firm
Q73: If the total cost of producing 2
Q76: Underemployed workers include individuals who are employed