The following graph shows the demand and cost curves of an imperfectly competitive firm.MC and ATC represent the marginal cost curve and the average cost curve respectively. Figure 8.1 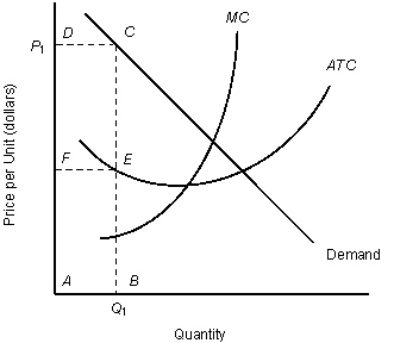 Refer to Figure 8.1.At price P1 the firm sells quantity Q1, and total cost is shown by:
Definitions:
Q11: Assume that the AD curve is held
Q26: Frictional and structural unemployment are always present
Q51: A variable-rate mortgage:<br>A)eliminates the risk of expected
Q53: When total planned expenditures are more than
Q57: The table given below states the value
Q72: The table given below shows the total
Q88: According to Table 6.1, marginal utility _.<br>A)increases
Q88: Demand-pull inflation is more likely to occur
Q90: The figure given below shows the cost
Q106: Quickie Inc. , a perfectly competitive firm,