The figure given below represents the equilibrium real GDP and price level in the aggregate demand and aggregate supply model. Figure 8.3 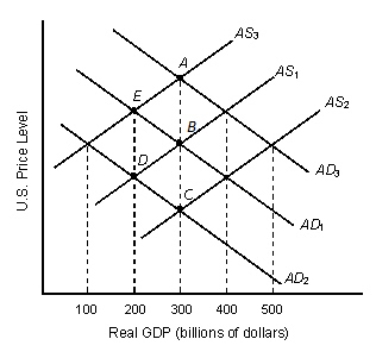 Refer to Figure 8.3.Potential GDP is greater than real GDP at all output levels:
Definitions:
Advertise
The action or process of promoting one's products or services in various media to attract potential customers or clients.
Joint Profits
The combined earnings accrued from the collaboration of two or more firms.
Nash Equilibrium
In game theory, the equilibrium that results when all players choose the action that maximizes their payoffs given the actions of other players, ignoring the effect of that action on the payoffs of other players; also known as noncooperative equilibrium.
Advertise
Advertising involves promoting products or services through various mediums to inform potential customers and influence their purchasing decisions.
Q10: Under imperfect competition:<br>A)demand curve lies below the
Q21: If the equilibrium level of income is
Q25: The amount of autonomous consumption in an
Q46: The income and substitution effects of a
Q54: The aggregate supply curve shows the negative
Q58: The principle that people would rather leave
Q58: If equilibrium in the economy is merely
Q78: Which of the following is true of
Q85: Which of the following is an incorrect
Q92: In the table given below Y represent