Multiple Choice
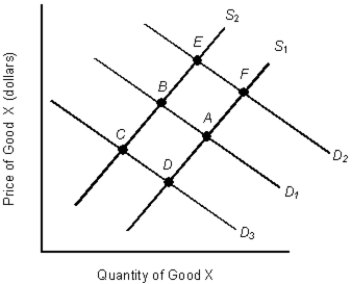
The figure given below shows the demand and supply curves in the market for coffee. S1 and D1 are the original demand and supply curves.Figure 3.5

-When a freely functioning market is in disequilibrium:
Definitions:
Related Questions
Q16: Margaret can use her quarterly savings to
Q23: The circular flow diagram shows the flow
Q34: Suppose 50 loaves of bread are demanded
Q41: Rupert,a very old man,suffers from bouts of
Q43: There are specific requirements for insurability which
Q46: Based on the fact that the companies
Q52: Which of the following will be categorized
Q67: The producer price index was earlier known
Q86: Recent amendments have expanded the FTC's powers.
Q123: Explain the law of agency,who is an