The below figure shows the demand and supply curves in the market for gasoline.The price and quantity at the point of intersection of the demand and supply curves is $30 and 300 gallons respectively. Figure 3.6 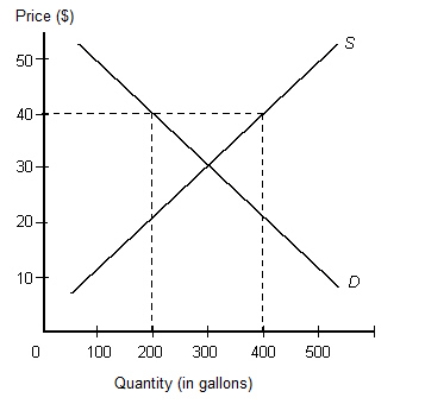 Assume that the market for gasoline in Figure 3.6 is in equilibrium.What is the most likely consequence of a government-imposed price ceiling at $10 per unit?
Definitions:
Central Planning
An economic system where all major production, investment, and distribution decisions are made by a central authority, typically the government.
Free Enterprise
An economic system in which private businesses operate in competition and largely free of state control, with minimal government intervention.
Price Mechanism
The method through which changes in supply and demand cause prices to increase or decrease, directing how resources are distributed in a market-based economy.
Market Failure
An instance where goods and services are distributed by an unregulated market in a manner that is not optimum, frequently causing a reduction in the total wellbeing of society.
Q2: If the demand for product R increases
Q4: The table given below reports the value
Q12: The figure given below represents the PPC
Q14: Which of the following would lead to
Q20: What is contractual capacity and who cannot
Q32: Which of the following statements is in
Q33: Which of the following statements is incorrect
Q35: If a society's scarce resources are allocated
Q48: An agent's duties when executing agency include:<br>A)reimbursement
Q94: A device cannot be patented if it