Multiple Choice
Figure 4-25
The graph below pertains to the supply of paper to colleges and universities. 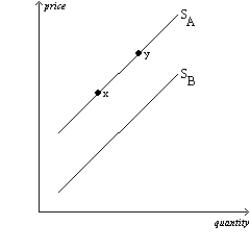
-Refer to Figure 4-25. All else equal, sellers expecting the price of paper to decrease next month when many college students leave campuses for the summer would cause a current move from
Definitions:
Related Questions
Q2: Refer to Table 4-10. If the four
Q95: The unique point at which the supply
Q175: Refer to Figure 5-11. If price increases
Q226: A decrease in supply is represented by
Q328: Refer to Figure 4-26. Which of the
Q351: Refer to Figure 4-28. Using the points
Q361: Refer to Figure 4-31. At a price
Q365: Which of the following might cause the
Q442: Refer to Table 4-8. Suppose Firm X
Q457: Refer to Table 4-8. If these are