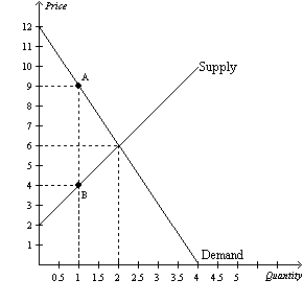
Figure 8-2
The vertical distance between points A and B represents a tax in the market. 
-Refer to Figure 8-2.The loss of producer surplus as a result of the tax is
Definitions:
Elastic
Describes a situation where the quantity demanded or supplied changes significantly when the price changes.
Marginal Revenue
The additional income received from selling one more unit of a good or service.
Marginal Cost
The additional cost incurred from producing one more unit of a good or service.
Profit Maximizes
The process or strategy of adjusting production and operations to achieve the highest possible profit.
Q10: Refer to Figure 7-19. At the equilibrium
Q42: Taxes are costly to market participants because
Q81: Refer to Table 7-12. If the sellers
Q96: Refer to Table 7-17. Both the demand
Q104: Refer to Figure 8-1. Suppose the government
Q212: If the labor supply curve is very
Q347: Refer to Figure 7-15. When the price
Q385: Refer to Figure 8-11. The size of
Q463: Refer to Scenario 8-3. Suppose that a
Q547: Refer to Figure 7-8. At the equilibrium