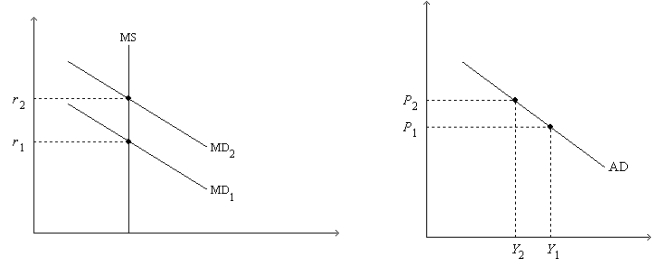
Figure 34-2. On the left-hand graph, MS represents the supply of money and MD represents the demand for money; on the right-hand graph, AD represents aggregate demand. The usual quantities are measured along the axes of both graphs.

-Refer to Figure 34-2. As we move from one point to another along the money-demand curve MD1,
Definitions:
Obsessive Thought
Persistent, unwanted, and intrusive ideas or impulses that can cause significant anxiety or distress.
Relaxation Technique
Strategies or exercises designed to reduce stress and anxiety, helping individuals achieve a state of calm.
Personal Space
The physical area surrounding an individual that they regard as psychologically theirs, invasion of which can lead to discomfort or anxiety.
Patient's Safety
The reduction of risk of unnecessary harm to an acceptable minimum in the healthcare setting, ensuring the well-being of patients.
Q39: Suppose the government raises taxes. Which curves
Q56: "Monetary policy can be described either in
Q283: An increase in taxes shifts the aggregate
Q286: The aggregate supply curve is upward sloping
Q289: Who said about classical economic theory: "the
Q329: Part of the explanation for why the
Q353: When output rises, unemployment falls.
Q372: List the three alternative explanations for the
Q387: Economists who are skeptical about the relevance
Q538: Other things the same, the aggregate quantity