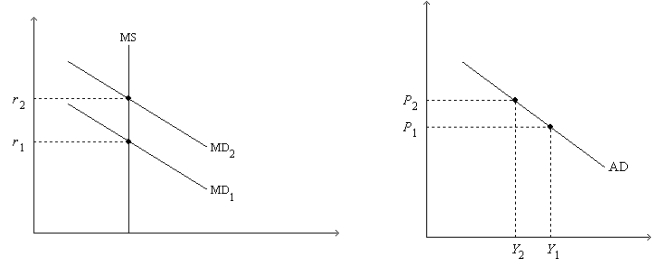
Figure 34-2. On the left-hand graph, MS represents the supply of money and MD represents the demand for money; on the right-hand graph, AD represents aggregate demand. The usual quantities are measured along the axes of both graphs.

-Refer to Figure 34-2. Assume the money market is always in equilibrium. Under the assumptions of the model,
Definitions:
Expected Income
The amount of money an individual or entity anticipates earning over a certain period.
Probability
The measure of the likelihood that a particular event will occur, often expressed as a number between 0 and 1.
Insurance Market
A marketplace where individuals and entities can purchase insurance products to transfer risk and receive financial protection against loss.
Asymmetric Information
A situation in which one party in a transaction has more or better information than the other party, often leading to an imbalance in a transaction.
Q3: Which of the following shifts aggregate demand
Q32: According to liquidity preference theory, if the
Q79: A decrease in government spending initially and
Q129: Suppose that businesses and consumers become much
Q134: A 2009 article in The Economist noted
Q139: When taxes increase, consumption<br>A) decreases as shown
Q318: The position of the long-run aggregate supply
Q381: The multiplier for changes in government spending
Q385: The logic of the exchange-rate effect begins
Q497: Suppose the economy is in long-run equilibrium.