Use the following information to answer the next questions.
The following graph depicts a market where a tax has been imposed. Pe was the equilibrium price before the tax was imposed, and Qe was the equilibrium quantity. After the tax, PC is the price that consumers pay, and PS is the price that producers receive. QT units are sold after the tax is imposed. NOTE: The areas B and C are rectangles that are divided by the supply curve ST. Include both sections of those rectangles when choosing your answers. 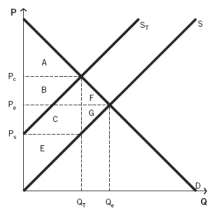
-What is the amount of the tax, as measured along the y axis?
Definitions:
Dollar Value
Dollar Value is the monetary worth or market value of something expressed in terms of US dollars.
Current Ratio
Current ratio is a liquidity ratio that measures a company's ability to pay short-term obligations or those due within one year.
Financial Statements
Formal records of the financial activities and position of a business, person, or other entity, typically including the balance sheet, income statement, and statements of cash flows.
Stock Market
A marketplace where shares of public companies are bought and sold, reflecting the economic trends and investment climate.
Q4: Inflation can create uncertainty by making:<br>A) the
Q32: The difference between the willingness to sell
Q49: Which of the following is a positive
Q50: What areas represent the total cost to
Q54: Which of the following will cause a
Q56: Quality changes:<br>A) are easily accounted for in
Q76: Suppose you live in a community with
Q85: Social welfare is measured as the sum
Q104: When supply shifts right and demand shifts
Q123: In NBC's hit TV show 30 Rock,