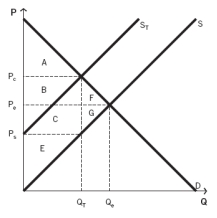
Use the following information to answer the next fifteen questions.
The following graph depicts a market where a tax has been imposed. Pₑ was the equilibrium price before the tax was imposed, and Qₑ was the equilibrium quantity. After the tax, PC is the price that consumers pay, and PS is the price that producers receive. QT units are sold after the tax is imposed. NOTE: The areas B and C are rectangles that are divided by the supply curve ST. Include both sections of those rectangles when choosing your answers.

-Which areas represent consumer surplus before the tax is imposed?
Definitions:
Linear Equations
Mathematical statements that show the relationship between two variables using a straight line when plotted on a graph.
Linear Equation
An algebraic equation in which each term is either a constant or the product of a constant and a single variable.
Linear Graphing
A method of representing data or mathematical functions where relationships are shown as straight lines on a graph.
Net Income
The total earnings of a company after deducting all expenses, taxes, and costs from its total revenue.
Q2: If the price of industrial plastic injection
Q14: Bob wins the lottery. This _ included
Q20: All taxes create some deadweight loss except
Q52: If a tax is imposed on a
Q54: When demand is perfectly inelastic, the demand
Q67: What is the total amount of producer
Q73: In Las Vegas, the cost of living
Q102: When you include discouraged workers and unemployed
Q110: A model without any simplifying assumptions:<br>A) is
Q115: Explain what happens to the amount of