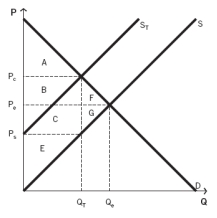
Use the following information to answer the next fifteen questions.
The following graph depicts a market where a tax has been imposed. Pₑ was the equilibrium price before the tax was imposed, and Qₑ was the equilibrium quantity. After the tax, PC is the price that consumers pay, and PS is the price that producers receive. QT units are sold after the tax is imposed. NOTE: The areas B and C are rectangles that are divided by the supply curve ST. Include both sections of those rectangles when choosing your answers.

-Which areas represent consumer surplus after the tax is imposed?
Definitions:
Expected Monetary Values
A financial concept that represents the average outcome when the future includes scenarios that may or may not happen.
Index Funds
Investment funds that replicate the performance of a specific index by holding all or a representative sample of the securities in the index.
PHStat
An Excel add-in that enhances the statistical capabilities of Microsoft Excel, allowing for more advanced data analysis.
Full-fare Air Ticket
A Full-fare Air Ticket is the purchase price for an airline seat without any discounts or promotions, usually offering maximum flexibility in terms of changes and cancellations.
Q3: If a minimum wage is set at
Q6: Oranges become more expensive in 2008 at
Q18: Imagine you find yourself in a heat
Q42: When testing a paper airplane on your
Q50: What areas represent the total cost to
Q50: The natural rate of unemployment is:<br>A) the
Q62: Explain why a shortage occurs in a
Q72: Which of the following is a positive
Q121: The recession of 2007-2009 has been dubbed:<br>A)
Q122: When a hurricane rips through Florida, the