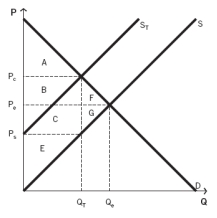
Use the following information to answer the next fifteen questions.
The following graph depicts a market where a tax has been imposed. Pₑ was the equilibrium price before the tax was imposed, and Qₑ was the equilibrium quantity. After the tax, PC is the price that consumers pay, and PS is the price that producers receive. QT units are sold after the tax is imposed. NOTE: The areas B and C are rectangles that are divided by the supply curve ST. Include both sections of those rectangles when choosing your answers.

-Which areas represent the amount of producer surplus lost due to the tax?
Definitions:
Simulation Models
Are computational tools used to imitate the operations of real-world processes or systems for the purpose of analysis or decision-making.
Setup Cost
The expenses associated with configuring or preparing equipment, machinery, or production lines for manufacturing a new product batch or type.
Operate
Operate refers to the process of controlling and managing the functions of systems, machinery, or organizations.
Strategic Planning
A systematic process for envisioning a desired future and translating this vision into broadly defined goals or objectives and a sequence of steps to achieve them.
Q21: In 1985, International Data Corp. (IDC) estimated
Q27: A tax on milk would likely cause
Q36: On January 30, 2012, Starbucks India announced
Q37: Two goods that are used together are
Q45: What was the growth rate of real
Q68: The cost to society created by distortions
Q91: How do producers who are subject to
Q98: Which two countries have the same average
Q112: One shortcoming of the official unemployment rate
Q135: If real GDP grew by 2% and