The following figure depicts the downward-sloping market demand (D) curve for a five-day western Caribbean cruise on Carnival Cruise Lines.The price (P) is per person in U.S.dollars,and the quantity (Q) is the number of passenger tickets sold.This figure also shows the company's relevant marginal revenue (MR) curve and marginal cost (MC) curve.Use this figure to answer the following questions:
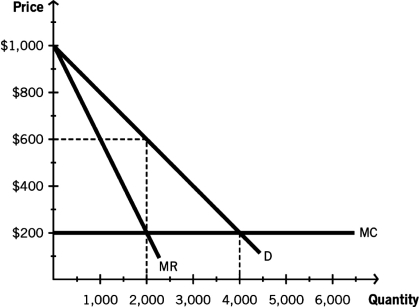
-If this cruise line is a monopoly that charges a single price of $600 per passenger,what is the amount of consumer surplus?
Definitions:
Leadership Grid
A framework for understanding leadership styles based on concern for people and concern for production.
Leader Behaviors
The actions and decisions taken by a leader that influence the group's performance, direction, and cohesion.
Blake And Mouton
Blake and Mouton proposed the Leadership Grid, which identifies leadership styles based on managers' concern for people versus their concern for production, categorizing leaders into types such as "team leader" or "authority-compliance" leader.
Behavioral Styles
The range of individuals' conduct patterns, emphasizing how personal actions, communication modes, and reactions influence interactions and outcomes.
Q42: If a monopolist is producing a quantity
Q44: As production increases, the price consumers are
Q58: Monopolists:<br>A) enjoy market power for their specific
Q58: When a market is characterized by mutual
Q68: Assume that the price per duffle bag
Q89: Which of the following is a characteristic
Q100: Which of the following conditions will result
Q116: One possible outcome of promoting competition is:<br>A)
Q133: Steve's average variable cost was _ per
Q146: The best way to limit competition is