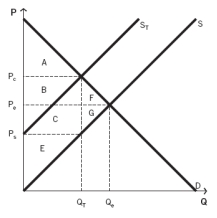
Use the following information to answer the next fifteen questions.
The following graph depicts a market where a tax has been imposed. Pₑ was the equilibrium price before the tax was imposed, and Qₑ was the equilibrium quantity. After the tax, PC is the price that consumers pay, and PS is the price that producers receive. QT units are sold after the tax is imposed. NOTE: The areas B and C are rectangles that are divided by the supply curve ST. Include both sections of those rectangles when choosing your answers.

-What is the total amount of producer and consumer surplus (i.e.,social welfare) in this market before the tax is imposed?
Definitions:
Competitive Industry
An industry landscape where multiple firms compete against each other, often leading to innovation and lower prices for consumers.
Competitive Industry
A market sector characterized by many firms competing against each other for customers, leading to innovation and lower prices.
Market Demand
The total quantity of a particular good or service that all consumers in a market are willing and able to purchase at various prices.
Competitive Industry
An industry environment where numerous competitors offer similar products or services, resulting in the need for businesses to vie for market share and customer attention.
Q8: The benefit to society from the imposition
Q41: When supply shifts left and demand shifts
Q45: Kim attends the farmer's market in her
Q58: Refer to the accompanying figure. Point _
Q103: The music you buy on the Internet
Q107: According to the supply and demand model,
Q114: When a firm grows larger, many additional
Q122: When you change your quantity demanded of
Q131: Holding all else constant, a decrease in
Q151: Assume that a $0.25/gallon tax on milk