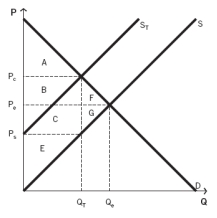
Use the following information to answer the next fifteen questions.
The following graph depicts a market where a tax has been imposed. Pₑ was the equilibrium price before the tax was imposed, and Qₑ was the equilibrium quantity. After the tax, PC is the price that consumers pay, and PS is the price that producers receive. QT units are sold after the tax is imposed. NOTE: The areas B and C are rectangles that are divided by the supply curve ST. Include both sections of those rectangles when choosing your answers.

-What areas represent the deadweight loss created as a result of the tax?
Definitions:
Market Price
The immediate cost at which one can buy or sell an asset or service within the market context.
Additional Report
Supplementary document or analysis that provides extra information beyond the initial report or analysis.
Marginal Cost
The additional financial burden of producing one more unit of a product or service.
Break-even Price
The price level at which a business does not make a profit or a loss.
Q6: Refer to the accompanying graph. <img src="https://d2lvgg3v3hfg70.cloudfront.net/TB4868/.jpg"
Q11: Used car dealers find that their sales
Q11: A good that is nonrival and nonexcludable
Q20: Refer to the accompanying figure. A firm
Q58: Refer to the accompanying figure. When the
Q90: The percentage change in price is 5%,
Q114: The costs of a market activity paid
Q116: What is a black market?<br>A) It is
Q119: Club goods are:<br>A) nonrival, like public goods,
Q131: Higher input costs:<br>A) reduce profits.<br>B) increase profits.<br>C)