The manager of a commuter rail transportation system is asked by his governing board to predict the demand for rides in the large city served by the transportation network. The system manager has collected data on variables thought to be related to the number of weekly riders on the city's rail system. The table shown below contains these data. 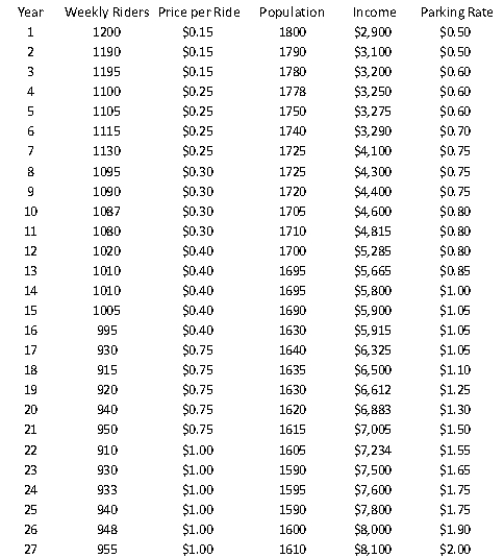 The variables "weekly riders" and "population" are measured in thousands, and the variables "price per ride", "income", and "parking rate" are measured in dollars.
-(A) Estimate a multiple regression model using all of the available explanatory variables.
(B) Conduct and interpret the result of an F- test on the given model. Employ a 5% level of significance in conducting this statistical hypothesis test.
(C) Is there evidence of autocorrelated residuals in this model? Explain why or why not.
Definitions:
Balance Sheet
A document that outlines the financial position of a company, including assets, liabilities, and equity of the shareholders, at a certain time.
Biweekly Salaries
Payroll disbursements made to employees every two weeks, totaling twenty-six payments annually.
Fiscal Period
Any designated period of time for accounting purposes, typically a year, used by governments and businesses for financial reporting and budgeting.
Adjusting Entry
A journal entry made at the end of an accounting period to update the accounts and ensure they reflect the true financial position of the business.
Q4: The divisibility property of LP models simply
Q16: If a scatterplot of residuals shows a
Q48: In conducting hypothesis testing for difference between
Q52: Examples of non-random patterns that may be
Q54: A moving average is the average of
Q57: In a multiple regression analysis involving 4
Q58: Generate a statistical summary and risk profile
Q59: Suppose a firm must at least meet
Q79: A point that "tilts" the regression line
Q90: A shortcoming of the RMSE (root mean