In their study of 'Using individual growth model to analyse the change in quality of life from adolescence to adulthood', Chen and Cohen (2006) conducted interviews on three different occasions over a period of time, and the following graph demonstrates the physical health changes noted over these three periods in 20 of their sample. 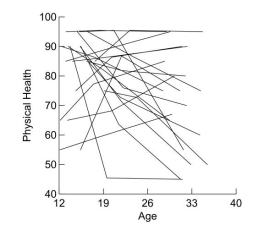 Individual Physical Health Change (raw data, n = 20)
What does the graph illustrate?
Definitions:
Fish
Aquatic, gill-breathing vertebrates that are often covered with scales and equipped with fins, playing varied roles in ecological systems and as subjects in scientific research.
General Laws Of Learning
Theoretical principles that aim to explain how learning processes are similar across different situations and organisms.
Enhance Organization
Strategies or practices aimed at improving the structure and efficiency of an organization or group.
Reflexes
Automatic, involuntary responses to specific stimuli that are mediated by the nervous system.
Q1: If the null hypothesis is true and
Q2: What does the independent t-test test assume?<br>A)There
Q2: What is the relationship between sample size
Q3: Which test can be considered the non-parametric
Q5: A demand characteristic is:<br>A)A personality trait that
Q13: A study undertaken by an unknown author
Q15: In a repeated-measures design with one factor
Q19: If a test is valid, what does
Q23: The number of hours spent practising and
Q24: What was the dependent variable in the