The following scatterplot represents the results of a study undertaken by Chakrabarty et al. (2005) who were investigating glutamate levels in psychotropic drug-naive OCD patients and comparing them with psychiatrically normal controls. Findings were reported as follows for CSF glutamate levels in OCD patients compared to controls: F(1,29) =11.153, p = 0.002. How would these findings be interpreted? 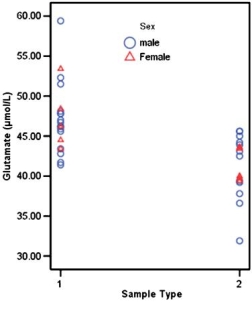 Scatterplot showing CSF glutamate levels in patients (1) and controls (2) .
Definitions:
Deadweight Loss
A loss of economic efficiency that can occur when the equilibrium for a good or a service is not achieved or is not achievable.
Consumer Surplus
The difference between the total amount that consumers are willing to pay for a good or service and the total amount they actually do pay.
Consumer Surplus
The difference between what consumers are willing to pay for a good or service and what they actually pay, indicating the economic benefit to consumers.
Equilibrium Price
The price at which the quantity of a good or service demanded by consumers equals the quantity supplied by producers.
Q1: In the above study, which statement is
Q2: A Bonferroni correction is when<br>A) You apply
Q6: If a researcher was interested in the
Q10: Which of the following statements best describes
Q11: Looking at the graph below, approximately what
Q11: In a study of elderly experience of
Q12: When conducting an ANCOVA, which would be
Q16: Plot the FEV<sub>1</sub> data presented in Q11
Q16: Which of the following is not an
Q24: What is not a form of counterbalancing?<br>A)