The following scatterplot represents the results of a study undertaken by Chakrabarty et al. (2005) who were investigating glutamate levels in psychotropic drug-naive OCD patients and comparing them with psychiatrically normal controls. Based on this scatterplot the following ANCOVA of glutamate levels in CSF was done. Findings were reported as follows for CSF glutamate levels in OCD patients compared to controls: F(1,29) =11.153, p=0.002. What conclusion can be drawn about this result?  Scatterplot showing CSF glutamate levels in patients (1) and controls (2) .
ANCOVA of Glutamate Levels in CSF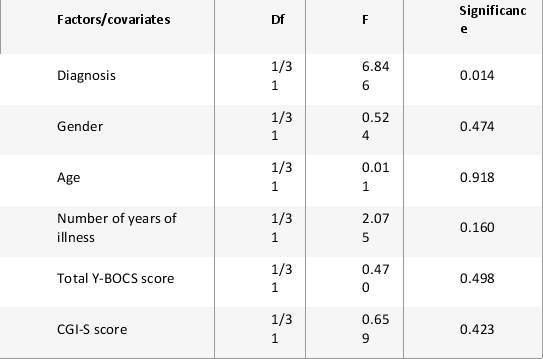 Diagnosis (OCD vs Controls) and gender were included as factors, while age, number of years of illness, total Y-BOCS scores, and CGI-S scores were included as covariates in the analysis.
Definitions:
Power Curve
A graphical representation used in statistics to show the probability of rejecting the null hypothesis at various effect sizes.
Power of the Test
The probability that a statistical test will correctly reject a false null hypothesis, indicating the test's ability to detect an effect when there is one.
Confidence Interval Estimate
A range of values derived from sample statistics that is likely to contain the value of an unknown population parameter, with a certain level of confidence.
99%
Often refers to a confidence level in statistics, indicating that there is a 99% chance the results fall within a specified range.
Q1: What does the presence of parallel lines
Q3: In determining the odds that a specific
Q3: For a main effect or an interaction
Q4: Post hoc tests were run using the
Q8: In IBM SPSS, where in the <img
Q9: How would you use the drop-down menus
Q17: Which variable would be considered the between-groups
Q17: Which procedure could be used to determine
Q20: An experiment was carried out in which
Q22: Which of the following is not an