The following scatterplot represents the results of a study undertaken by Chakrabarty et al. (2005) who were investigating glutamate levels in psychotropic drug-naive OCD patients and comparing them with psychiatrically normal controls. Findings were reported as follows for CSF glutamate levels in OCD patients compared to controls: F(1,29) =11.153, p = 0.002. How would these findings be interpreted? 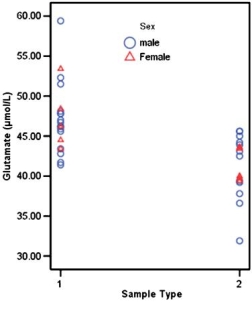 Scatterplot showing CSF glutamate levels in patients (1) and controls (2) .
Definitions:
Firm's Production
The total amount of goods and services produced by a business within a specific period, influenced by factors such as labor, capital, and technology.
Demand Curve
A visual representation detailing how consumer demand for a product changes in relation to its price.
Cost Function
A cost function describes the cost of producing a certain number of goods or services, taking into account factors like labor and materials.
Cartel Arrangement
An agreement among competing firms to control prices or production in a particular market, often to maximize collective profits.
Q2: In IBM SPSS, where in the <img
Q2: In which of the following situations is
Q5: In a simple analysis of variance problem,
Q11: What is not an advantage of repeated-measures
Q13: Logistic regression is most appropriate on which
Q13: Calculate the mean sum of squares of
Q14: In a factorial design with two factors,
Q15: With conventional coding in logistic regression of
Q18: What assumption does ANCOVA have that ANOVA
Q44: What is the parametric equivalent of a