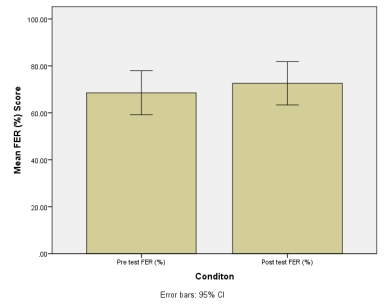
Researchers were interested in finding out how the respiratory parameters in a group of individuals who were diagnosed with asthma responded to a six-week aerobic training intervention. Forced expired ratio (FER, %) is the product of the forced expired ratio in 1 second (FEV1, litres) divided by the forced vital capacity (FVC, litres) and was the parameter the researchers were most interested in. The results are presented below. Enter the data into SPSS and plot a bar chart representing the mean of the pre- and post-test data. Add the 95% confidence intervals for the mean. You should get the bar chart shown below. What does the 95% confidence interval (CI) that you have plotted refer to? 
Definitions:
Q4: Researchers were interested in finding out how
Q5: Varimax rotation should be used when<br>A) Factors
Q7: When exploring the data before performing a
Q8: The t-test tests for<br>A) Differences between means.<br>B)
Q11: Of the following results of studies undertaken,
Q17: In SPSS, what is the data view
Q19: When would you consider converting χ<sup>2</sup> to
Q22: The equilibrium model of island biogeography predicts<br>A)
Q23: During El Niño events,<br>A) Australia experiences drought.<br>B)
Q24: Examine the following scatterplot. How would you