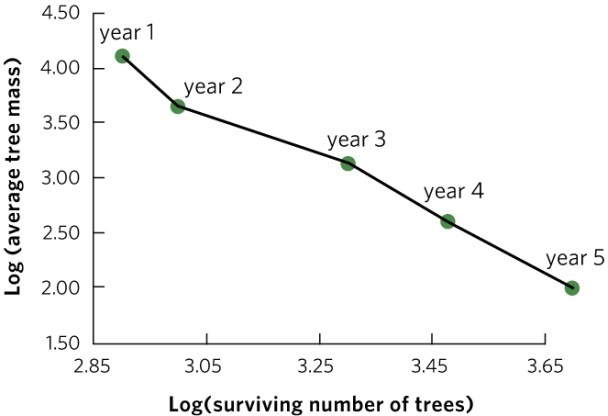
The graph shows one possible answer; students will have their own values. The figure should show log-transformed mass on the y axis and log-transformed survival on the x axis. The points they plot should form a negative slope.
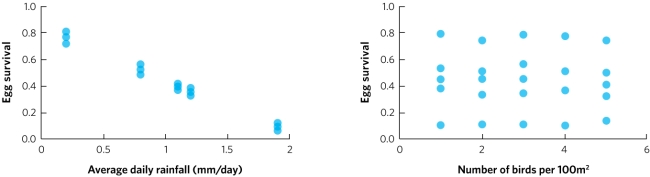
-A biologist studies a population of birds for 25 years. Each year the biologist records the amount of rainfall and the density of birds (number of birds per 100 square metres). Additionally, the biologist determines the survival rate for eggs laid that year. The biologist then plots egg survival rate against both rainfall (graph a) and bird density (graph b). In each plot the individual points represent the data for one year of the study. Based on these data, does this population of birds appear to have positive density-dependent population regulation, negative density-dependent population regulation, or density-independent population regulation? As part of your answer, list the prediction for each type of population regulation and explain whether the data meet that prediction.
Definitions:
Altruism
The principle or practice of showing concern for the welfare of others, often at a cost to oneself, motivated by selfless concerns.
Social Interactions
The process by which individuals act and react in relation to others, forming the basis of society.
Emotions
Complex psychological states that involve a subjective experience, physiological response, and a behavioral or expressive response.
Universal
Applies or is relevant to all members within a group or category without exception; embracing or applicable in all cases.
Q1: <img src="https://d2lvgg3v3hfg70.cloudfront.net/TB5501/.jpg" alt=" (Figure 16.8c
Q10: Tansley's experiments with bedstraw (Galium) showed that
Q13: The phenomenon by which moths in England
Q27: Territoriality develops when<br>A) a resource can be
Q36: Describe the process that forms bogs in
Q38: Infection tolerance is the ability of a
Q41: How do gaps affect climax communities? Does
Q45: The ocean zone with the highest productivity
Q48: Which of the following ions is NOT
Q51: Simultaneous examination of predator and prey population