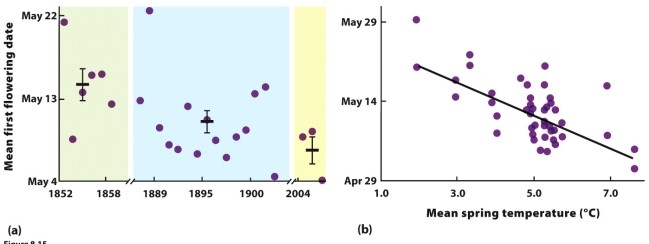
-The data in the figure show a relationship between the mean flowering date for many plant species around Concord, New Hampshire, in the United States, and the mean spring temperature over a time span exceeding 150 years. However, there is a lot of scatter around the best-fit line in panel
b. What information in the chapter might suggest the source of this scatter, and what does it imply about the plant species' cues for flowering?
Definitions:
Anatomy
The branch of biology concerned with the study of the structure of organisms and their parts.
Physiology
The branch of biology that deals with the functions and activities of living organisms and their parts, including all physical and chemical processes.
GI
Short for gastrointestinal, relating to the stomach and intestines.
Oxygen
A chemical element (O) vital for most forms of life on Earth, involved in cellular respiration.
Q5: Which of the following in NOT an
Q13: Which level of ecological hierarchy includes the
Q20: When an extreme phenotype has higher fitness
Q25: The surface temperature of Mars averages approximately
Q30: The viceroy (Limenitis archippus) is an unpalatable
Q31: During summer equinox in the Northern Hemisphere
Q46: Darwin supported his argument for evolution by
Q49: Which variable best summarizes the response to
Q59: Tigriopus copepods living in ocean tide pools
Q103: Which of the following groups has the