Figure 8-20
On the vertical axis of each graph, DWL is deadweight loss.
-Refer to Figure 8-20. Which graph correctly illustrates the relationship between the size of a tax and the size of the deadweight loss associated with the tax? 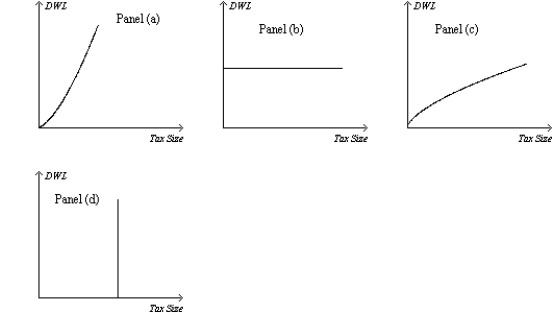
Definitions:
Fruits
Edible plant structures that contain seeds, often sweet and consumed as part of a healthy diet for their nutrients and fiber.
Complex Carbohydrates
Carbs consisting of long chains of sugar molecules that provide sustained energy, found in foods like whole grains, legumes, and vegetables.
Added Sugars
Sugars and syrups that are added to foods or beverages during processing or preparation, not naturally occurring.
Daily Recommended
A guideline or amount suggested for consumption or usage each day to maintain health or achieve specific dietary or nutritional goals.
Q104: Refer to Figure 8-9. The producer surplus
Q245: Each seller of a product is willing
Q284: Refer to Figure 8-6. When the tax
Q298: Suppose John's cost for performing some carpentry
Q300: When a tax is imposed on sellers,
Q335: Efficiency refers to whether a market outcome
Q337: Refer to Figure 9-1. From the figure
Q422: A country has a comparative advantage in
Q476: The willingness to pay is the maximum
Q498: When a good is taxed, the burden