Multiple Choice
Figure 13-9
The figure below depicts average total cost functions for a firm that produces automobiles. 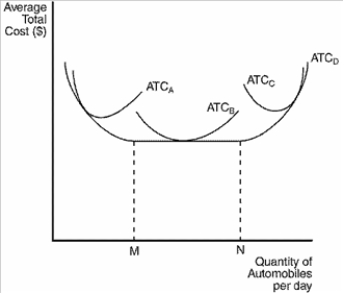
-Refer to Figure 13-9. Which curve represents the long-run average total cost?
Definitions:
Related Questions
Q8: A lump sum tax can never have
Q18: Which of the following can be added
Q69: Refer to Figure 13-10. The firm experiences
Q73: The amount of money that a wheat
Q124: Briefly evaluate the advantages and disadvantages of
Q163: Briefly describe the tradeoff between equity and
Q178: At low levels of production, the firm<br>A)
Q186: Consider a firm operating in a competitive
Q260: Diseconomies of scale occur when<br>A) average fixed
Q316: What are the two main sources of