Figure 18-8
This figure below shows the labor market for automobile workers. The curve labeled S is the labor supply curve, and the curves labeled D1 and D2 are the labor demand curves. On the horizontal axis, L represents the quantity of labor in the market. 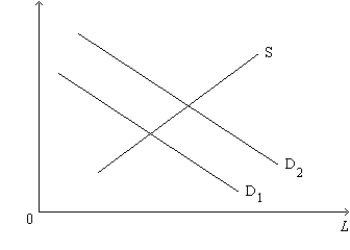
-Refer to Figure 18-8. Which of the following events would most likely explain a shift of the labor-demand curve from D2 back to D1?
Definitions:
Q17: Refer to Figure 18-2. The marginal product
Q17: Who among the following individuals most likely
Q51: Briefly describe the business practice of tying.
Q53: Sunshine's Organic Market sells organic produce. Assume
Q119: For a profit-maximizing, competitive firm, the value
Q167: Refer to Figure 18-3. What is the
Q176: Nancy and Sheila are both loan officers
Q343: The value of the marginal product of
Q344: The most popular movie stars have high
Q426: Consider a market served by a monopolist,