Figure 21-17 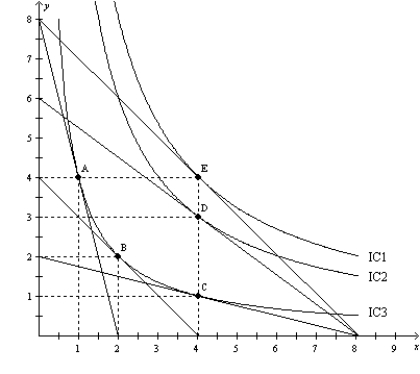
-Refer to Figure 21-17. When the price of X is $6, the price of Y is $24, and income is $48, Paul's optimal choice is point C. Then the price of Y decreases to $8. Paul's new optimal choice is point
Definitions:
Total Revenues
The total income received by a firm from its sales of goods or services, calculated by multiplying the selling price by the quantity sold.
Income Elasticity
A measure of how the demand for a good or service changes with a change in the consumer's income.
Price Elasticity
A measure of how much the quantity demanded of a good responds to a change in its price, with high elasticity indicating greater responsiveness.
Total Expenditures
The sum of all spending or expenses incurred by an individual, household, or organization.
Q77: Over the past 50 years, the U.S.
Q86: In 2011, the poverty rate in the
Q110: Giffen goods have positively-sloped demand curves because
Q206: Refer to Figure 21-32. Of the four
Q270: Refer to Figure 21-8. You have $600
Q289: The goal of utilitarians is to<br>A) apply
Q298: In 2011, the poverty rate in the
Q364: Refer to Table 22-4. If the mayor
Q375: Information asymmetry refers to<br>A) the tendency of
Q391: Refer to Scenario 20-7. Does Zooey owe