Essay
Figure 21-30 The graph shows two budget constraints for a consumer. 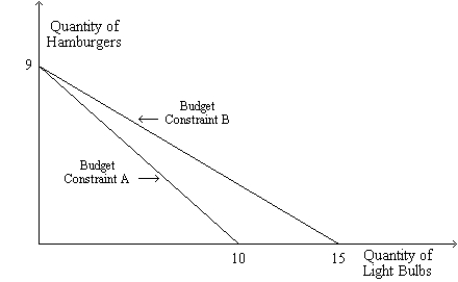
-Refer to Figure 21-30. Suppose the price of a hamburger is $10 and Budget Constraint A applies. What is the consumer's income? What is the price of a light bulb?
Definitions:
Related Questions
Q15: The following diagram shows two budget lines:
Q37: The indifference curves for nickels and dimes
Q70: Economists Cox and Alm compared the gap
Q130: Suppose that there are 175 voters in
Q144: For Meg, the substitution effect of an
Q151: Suppose a consumer has an income of
Q176: Your city newspaper publishes a "Best of"
Q210: Refer to Scenario 22-4. If, before any
Q334: In corporations, which of the following are
Q354: Refer to Table 22-16. Mr. Johnson recommends