Figure 26-4. On the horizontal axis of the graph, L represents the quantity of loanable funds in billions of dollars. 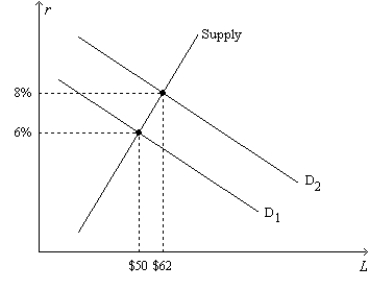
-Refer to Figure 26-4. Regard the position of the Supply curve as fixed, as on the graph. If the real interest rate is 8 percent, the inflation rate is 3 percent, and the market for loanable funds is in equilibrium, then the position of the demand-for-loanable-funds curve must be
Definitions:
Shareholders
Individuals or entities that own one or more shares of stock in a public or private corporation, giving them rights to dividends and a voice in corporate governance.
Corporation
A legal entity recognized by law, distinct from its owners, with rights to own property, sue or be sued.
Accounting System
A structured process used to collect, record, classify, summarize, and interpret financial information for decision making.
Classifies
To arrange or categorize entities based on shared characteristics or criteria.
Q6: Historical trends in the prices of most
Q32: Laura says that the present value of
Q76: If the interest rate is 2.49 percent,
Q99: Which of the following equations will always
Q144: Tami knows that people in her family
Q175: Other things the same, an increase in
Q417: Refer to Table 26-3. Determine the quantity
Q461: Refer to Table 26-2. Which company had
Q509: Which of the following events could explain
Q551: The indirect provision of funds by savers