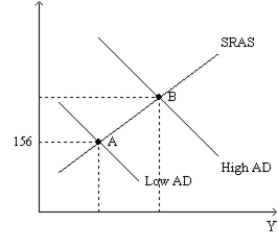
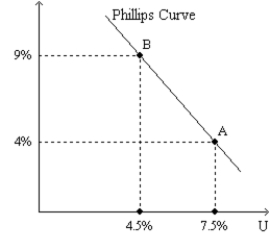
Figure 35-3.The left-hand graph shows a short-run aggregate-supply (SRAS) curve and two aggregate-demand (AD) curves.On the left-hand diagram,Y represents output and on the right-hand diagram,U represents the unemployment rate. 

-Refer to Figure 35-3.What is measured along the vertical axis of the left-hand graph?
Definitions:
Elastic Demand
A situation in which the demand for a product is sensitive to price changes, with significant changes in demand occurring with small changes in price.
Resource Demand
The demand for resources or inputs (like labor, capital, and raw materials) that are necessary for production.
Elasticity of Resource Demand
Measures the responsiveness of the quantity demanded of a resource to a change in its price, indicating how changes in price influence resource allocation.
Percentage Change
A mathematical calculation that represents the degree of change over time as a proportion of the initial value, often expressed as a percentage.
Q67: The government increases both its expenditures and
Q145: Samuelson and Solow believed that the Phillips
Q284: In the long run,<br>A) the natural rate
Q293: The Kennedy tax cut of 1964 included
Q325: If the Federal Reserve's goal is to
Q337: The analysis of Friedman and Phelps can
Q352: An adverse supply shock will shift short-run
Q376: According to Friedman and Phelps, the unemployment
Q403: A favorable supply shock causes output to<br>A)
Q437: According to liquidity preference theory, if the