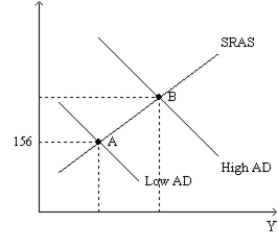
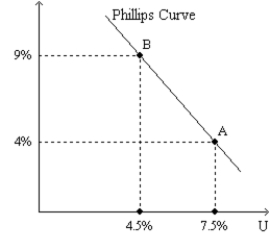
Figure 35-3.The left-hand graph shows a short-run aggregate-supply (SRAS) curve and two aggregate-demand (AD) curves.On the left-hand diagram,Y represents output and on the right-hand diagram,U represents the unemployment rate. 

-Refer to Figure 35-3.What is measured along the vertical axis of the right-hand graph?
Definitions:
Zero Defects
A management philosophy aiming at reducing and ideally eliminating defects and errors in manufacturing and service processes.
Quality
The degree to which a product or service meets or exceeds customer expectations.
Lean Environment
A management philosophy focusing on reducing waste and improving efficiency in the production process, often resulting in cost savings and higher quality products.
Operations
Activities carried out by a company to produce, buy, sell goods or services in the most efficient and effective manner.
Q86: If inflation expectations rise, the short-run Phillips
Q120: Although monetary policy cannot reduce the natural
Q154: Refer to Figure 34-13. The economy is
Q177: If the government cuts the tax rate,
Q240: As the MPC gets close to 1,
Q356: If the marginal propensity to consume is
Q369: Stimulus spending in 2009 was used for<br>A)
Q396: Suppose that the Federal reserve is concerned
Q412: are changes in fiscal policy that stimulate
Q454: As the aggregate demand curve shifts rightward