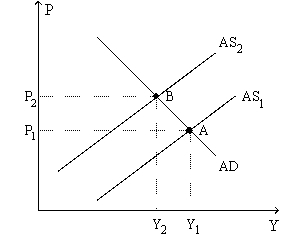
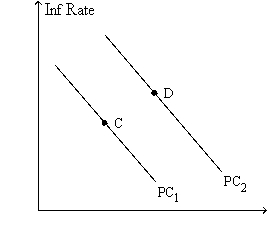
Figure 35-9. The left-hand graph shows a short-run aggregate-supply SRAS) curve and two aggregate-demand AD) curves. On the right-hand diagram, "Inf Rate" means "Inflation Rate." 

-Refer to Figure 35-9. Which of the following events could explain the shift of the aggregate-supply curve from AS1 to AS2?
Definitions:
Marginal Benefit
The extra pleasure or benefit derived from consuming an additional unit of a product or service.
Corporate Job
Employment within a company or organization that usually involves office-based work, specialized roles, and hierarchical positions.
Opportunity Cost
is the loss of potential gain from other alternatives when one alternative is chosen.
Rational Decisions
Choices made by individuals that align with their own self-interest and are based on an evaluation of the costs and benefits of the action.
Q30: The idea that the long-run Phillips curve
Q30: Economists agree that at least in the
Q67: A basis for the slope of the
Q73: If the central bank increases the growth
Q146: One of President Obama's first policy initiatives
Q151: Paul Volcker, former chair of the Fed,
Q176: The "natural" rate of unemployment is the
Q226: According to the political business cycle theory,
Q347: Proponents of tax-law changes to encourage saving
Q492: What actions could be taken to stabilize