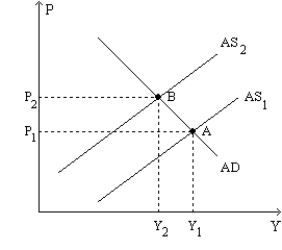
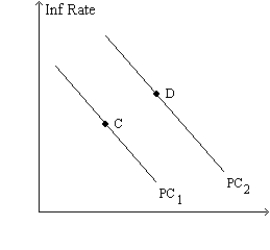
Figure 35-9.The left-hand graph shows a short-run aggregate-supply (SRAS) curve and two aggregate-demand (AD) curves.On the right-hand diagram,"Inf Rate" means "Inflation Rate." 

-Refer to Figure 35-9.A movement of the economy from point A to point B,and at the same time a movement from point C to point D,would be described as
Definitions:
Sleep Deprived
A condition resulting from not getting enough sleep, which can affect cognitive functions, mood, and overall health.
Cortical Responses
Cortical responses are the brain's reactions to stimuli, involving electrical activity in the cerebral cortex, which plays a key role in processing sensory information, thought, conscious movement, and much more.
Increased Risk
Refers to a situation where there is a higher likelihood of encountering harm or negative outcomes.
Gaining Weight
An increase in body weight.
Q25: Which of the following does not reduce
Q43: Assuming that the substitution effect is large
Q106: Friedman and Phelps believed that the natural
Q161: If a central bank were required to
Q212: A "lean against the wind" policy says
Q282: An increase in the natural rate of
Q295: Government deficits mean that<br>A) national saving is
Q447: To stabilize output, the Federal Reserve will
Q469: Policymakers use _ policy and _ policy
Q500: Changes in monetary policy aimed at reducing