Multiple Choice
 The figure above shows aggregate demand curves.
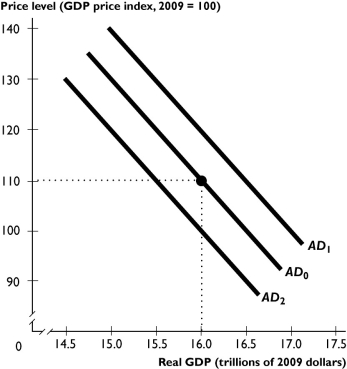
-Based on the figure above,the aggregate demand curve will shift from AD0 to AD2 when
Definitions:
Related Questions
Q52: During the late 1960s,U.S.defense spending increased as
Q95: When there is a threat of inflation
Q139: Needs-tested spending is best described as<br>A)spending on
Q204: A fall in the price level brings
Q242: If the Fed buys a $100,000 government
Q261: In the figure above,the economy is at
Q273: When the price level rises and the
Q277: Changes in which of the following do
Q286: Sherri lives in Canada and is considering
Q295: Moving along the AS curve,when the price