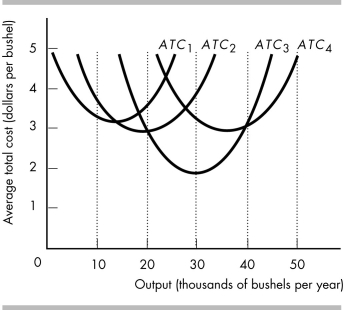
-The above figure represents the average total cost curves of a wheat farmer.
a) Which average total cost curve has the lowest average total cost of producing 30,000 bushels of wheat?
b) Over what range of output is the farmer experiencing economies of scale?
c) Over what range of output is the farmer experiencing diseconomies of scale?
d) Which average total cost curve has the lowest possible average cost of production?
e) Which average total cost curve represents the largest plant?
Definitions:
Q11: Anna owns a dog grooming salon in
Q134: "According to the Coase theorem,if Gabriel wants
Q150: If 9 workers can produce 1,550 units
Q164: Joanne rents a TV production studio to
Q172: Public provision<br>A)is the production of a good
Q173: If a struggling perfectly competitive furniture store
Q178: The average total cost curve is U-shaped.At
Q192: The figure above shows an education market
Q205: Imposing a tariff on a good leads
Q267: When a country exports a good,the country's