Multiple Choice
Figure 9-4
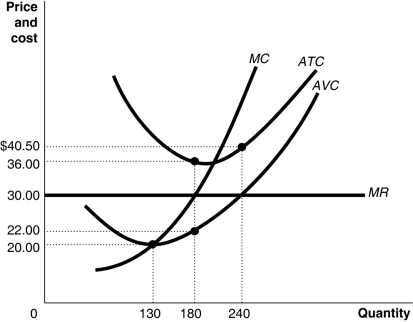 Figure 9-4 shows the cost and demand curves for a profit-maximizing firm in a perfectly competitive market.
-Refer to Figure 9-4.If the market price is $30 and the firm is producing output,what is the amount of the firm's profit or loss?
Definitions:
Related Questions
Q33: The benefit of an activity is<br>A)purely objective
Q71: If,in a perfectly competitive industry,the market price
Q84: What is a Giffen good?
Q103: The demand curve for a Giffen good
Q114: Refer to Figure 9-11.Suppose a typical firm
Q125: Refer to Table 9-1.What is the fixed
Q133: To graph a relationship involving more than
Q157: A fair number of people buy expensive
Q192: What must be true in terms of
Q341: John has two hours of free time