Table 8-3
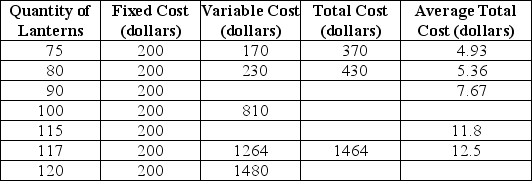 Table 8-3 shows cost data for Lotus Lanterns,a producer of whimsical night lights.
-Refer to Table 8-3.What is the variable cost of production when the firm produces 115 lanterns?
Definitions:
Budget Line
A budget line represents the combination of goods and services that a consumer can purchase given their income and the prices of those goods and services.
Consumer's Equilibrium
A state where an individual allocates their income in a way that maximizes their satisfaction or utility, given their budget.
Demand for Product X
The total quantity of Product X that consumers are willing and able to purchase at various price levels, within a given time frame.
Indifference Map
A graphical representation showing different bundles of goods between which a consumer is indifferent, illustrating preferences and trade-offs.
Q24: The economic model of consumer behavior explains
Q32: Which of the following statements is true
Q62: What are the main sources of health
Q88: Refer to Figure 8-3.What happens to the
Q99: Each point on a _ curve shows
Q100: Rank these three items in terms of
Q108: Compared to buying stock in a publicly-held
Q131: Refer to Figure 8-2.The average product of
Q152: Suppose that your public library charges a
Q341: John has two hours of free time