Multiple Choice
Figure 11-3 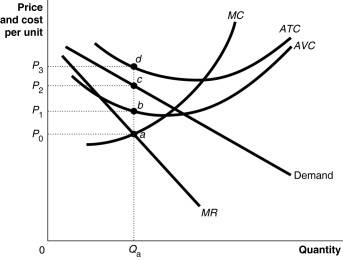 Figure 11-3 shows short-run cost and demand curves for a monopolistically competitive firm in the market for designer watches.
-Refer to Figure 11-3.What is the area that represents the loss made by the firm?
Definitions:
Related Questions
Q12: If a firm has excess capacity,it means<br>A)that
Q27: Holding everything else constant,government approval of horizontal
Q36: The term _ in economics refers to
Q41: Firms such as Caribou Coffee and Diedrich
Q52: For a natural monopoly to exist,<br>A)a firm
Q55: An increase in unemployment insurance payments would,in
Q84: Economics does not study correct or incorrect
Q92: Which of the following is not an
Q94: In monopolistic competition there is/are<br>A)many sellers who
Q121: The National Football League owns the NFL